Dynamic visualization of the impact of COVID-19 in border regions: result of the GRENSimpact project
November 29, 2024

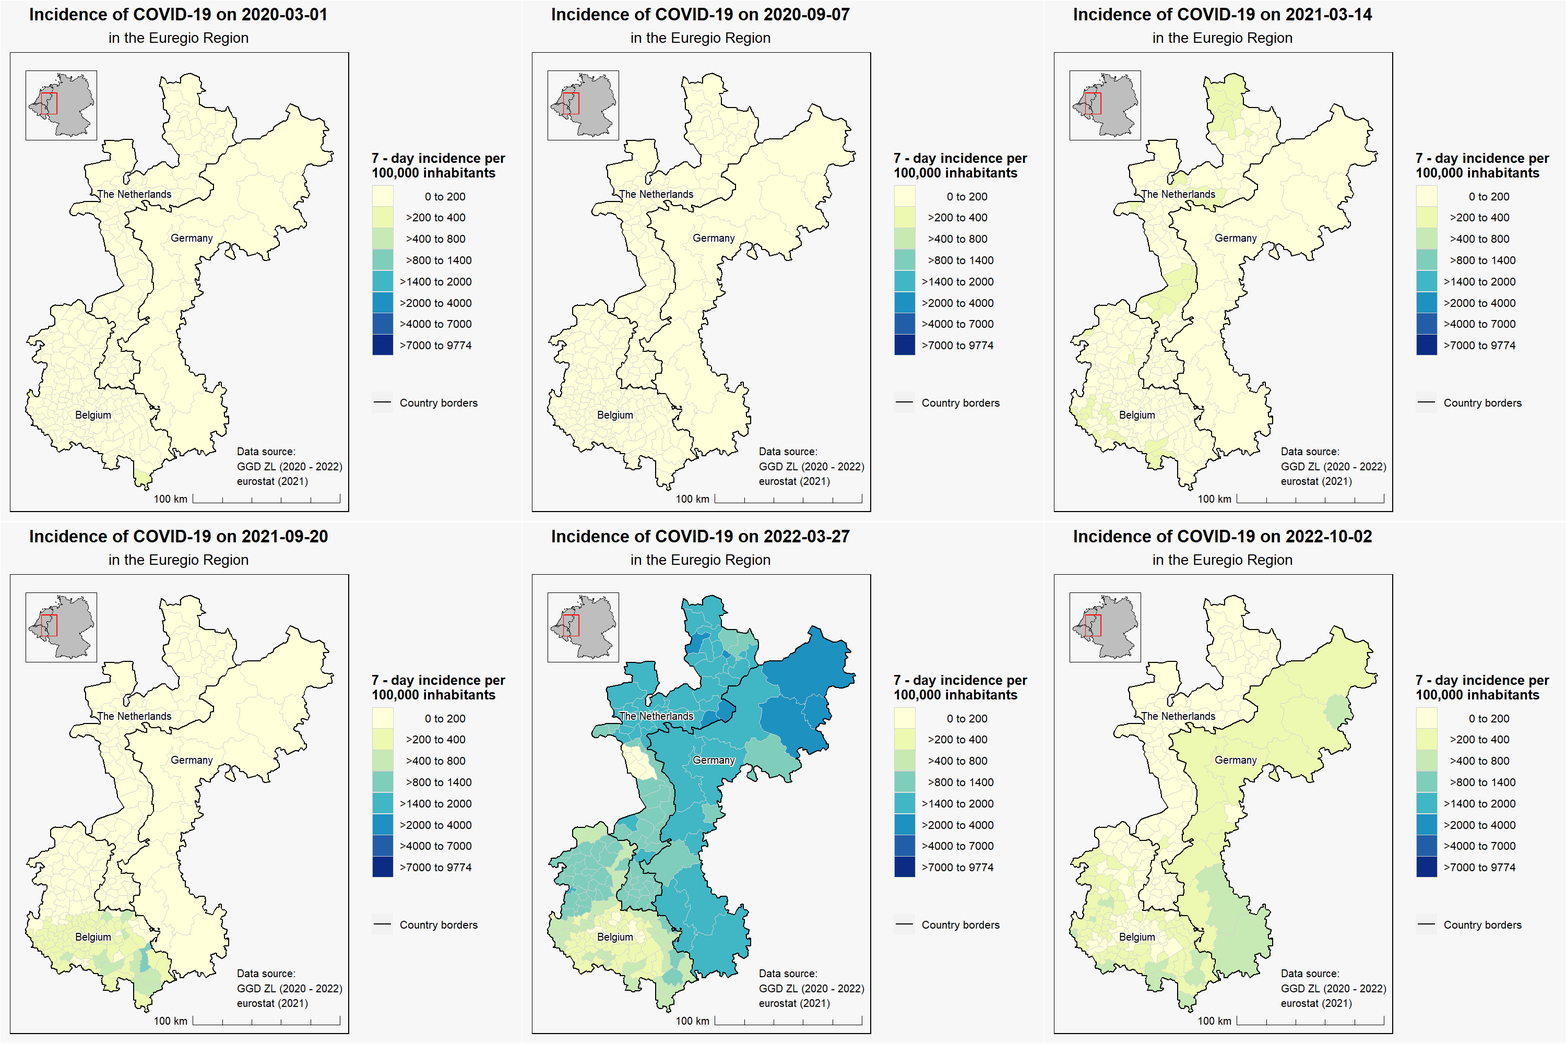
As part of the GRENSimpact project, an animated visualisation has been developed to illustrate the incidence of COVID-19 in the border regions of Belgium, the Netherlands, and Germany during the pandemic. Using Geographic Information System (GIS) methods, the animation dynamically presents the daily progression of COVID-19 transmission, revealing how the virus moved through these regions over time.
This visualization provides a clearer understanding of how the pandemic unfolded in border areas. By showing temporal and geographic trends, the animation offers valuable insights into the interconnectedness of border regions and the importance of coordinated public health approaches.
The animated visualisation presents complex data in a more accessible and engaging way. It highlights the value of cross-border monitoring and the need for collaborative efforts to address health crises effectively.
GRENSimpact is a collaboration between euPrevent and the Academic Workplace for Public Health Limburg (AWPG Mosa), funded by ZonMw.
Other results of the GRENSimpact have been published on the website: Factsheet – GRENSIMPACT.
